Black Friday Deal: 20% off with voucher code: PIXELGUARD20  |  Ends in:

Get Alerted When It Matters. Sleep When It Doesn’t.

Three ways to catch visual bugs: automatic checks during updates, scheduled monitoring on your timeline, or manual checks whenever you want. And when something breaks, you’ll know before your client does.

The Monitoring Dilemma

Option A:
Check every client site manually every day.

Result: No time left for actual work.

Option B:
Trust that nothing breaks.

Result: Client emails “THE SITE IS BROKEN” on Monday morning.

Option C:
Set up monitoring that alerts you for everything.

Result: Alert fatigue. You stop checking. See Option B.

You need Option D

Smart monitoring that only bothers you when it should.

Manual Checking Doesn’t Scale: Clicking through 10+ sites daily isn’t sustainable

Blind Trust Fails: Updates break things when you’re not watching

Alert Fatigue Kills: Too many notifications = ignored notifications
Monitoring That Respects Your Time

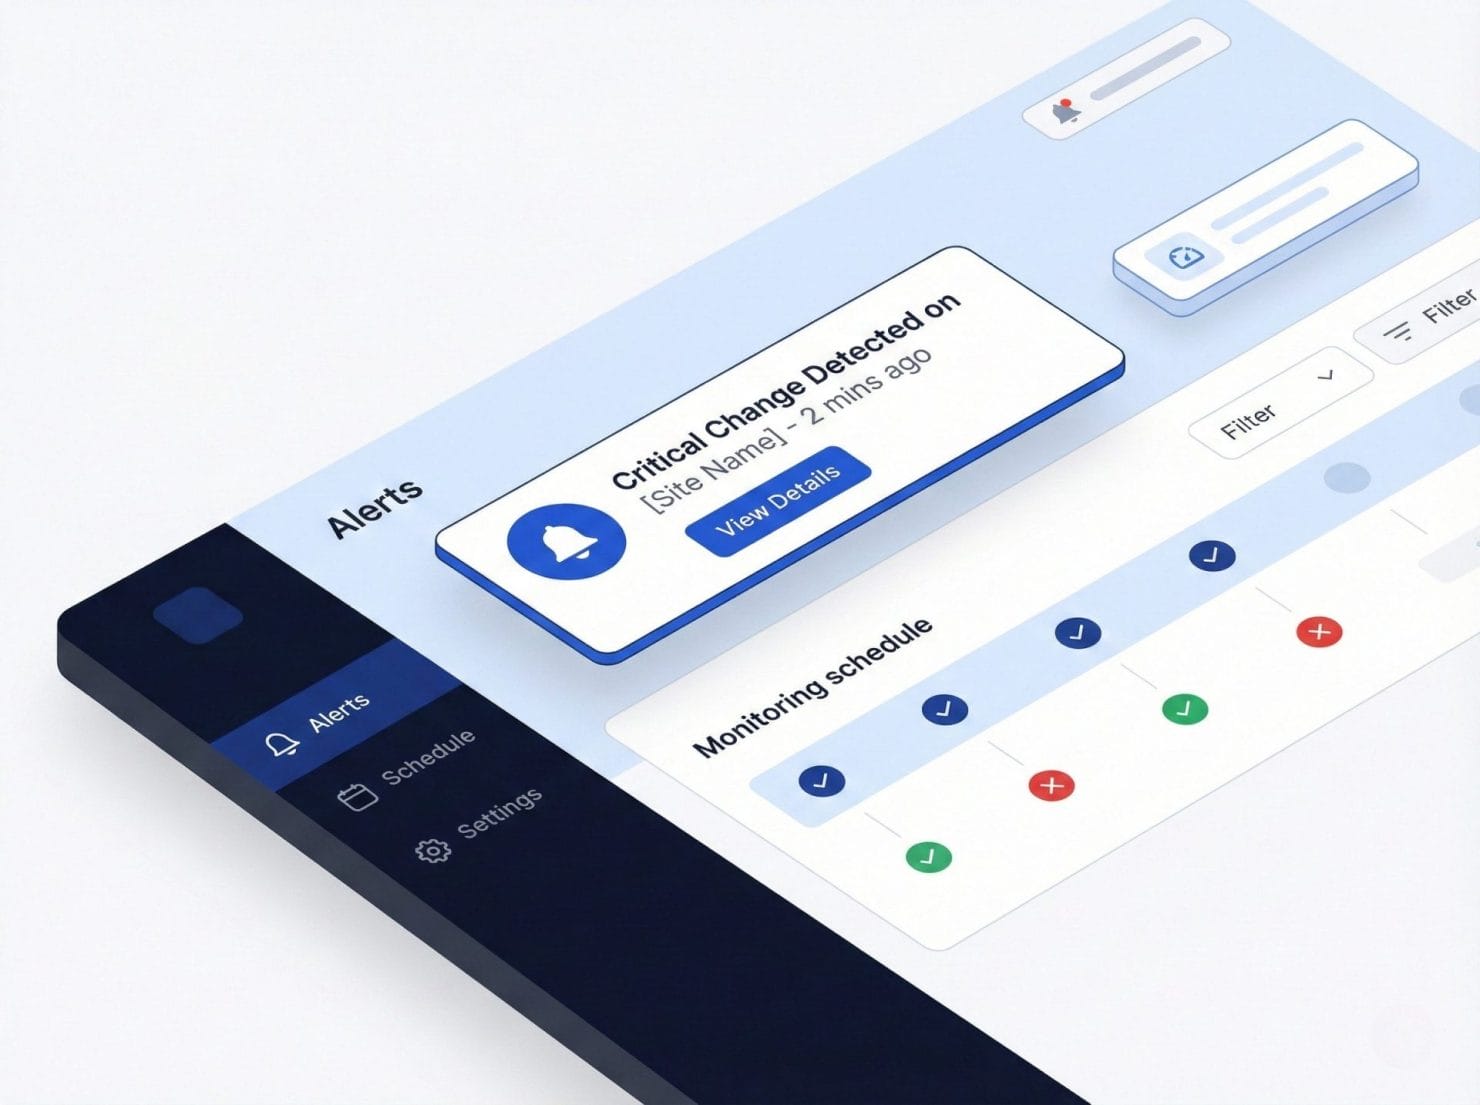
We check your sites automatically and alert you intelligently. Customize when we check, what threshold triggers alerts, and who gets notified. Get the coverage you need without the noise you don’t.

Smart Thresholds: Only get alerted when changes exceed your configured percentage

Flexible Scheduling: Check every 15 minutes or once daily—your choice

Targeted Notifications: Different alert recipients for different site groups
Auto-Update Checks

Automatically captures before-and-after screenshots whenever WordPress core, plugins, or themes update. That 3am security update? We were watching.

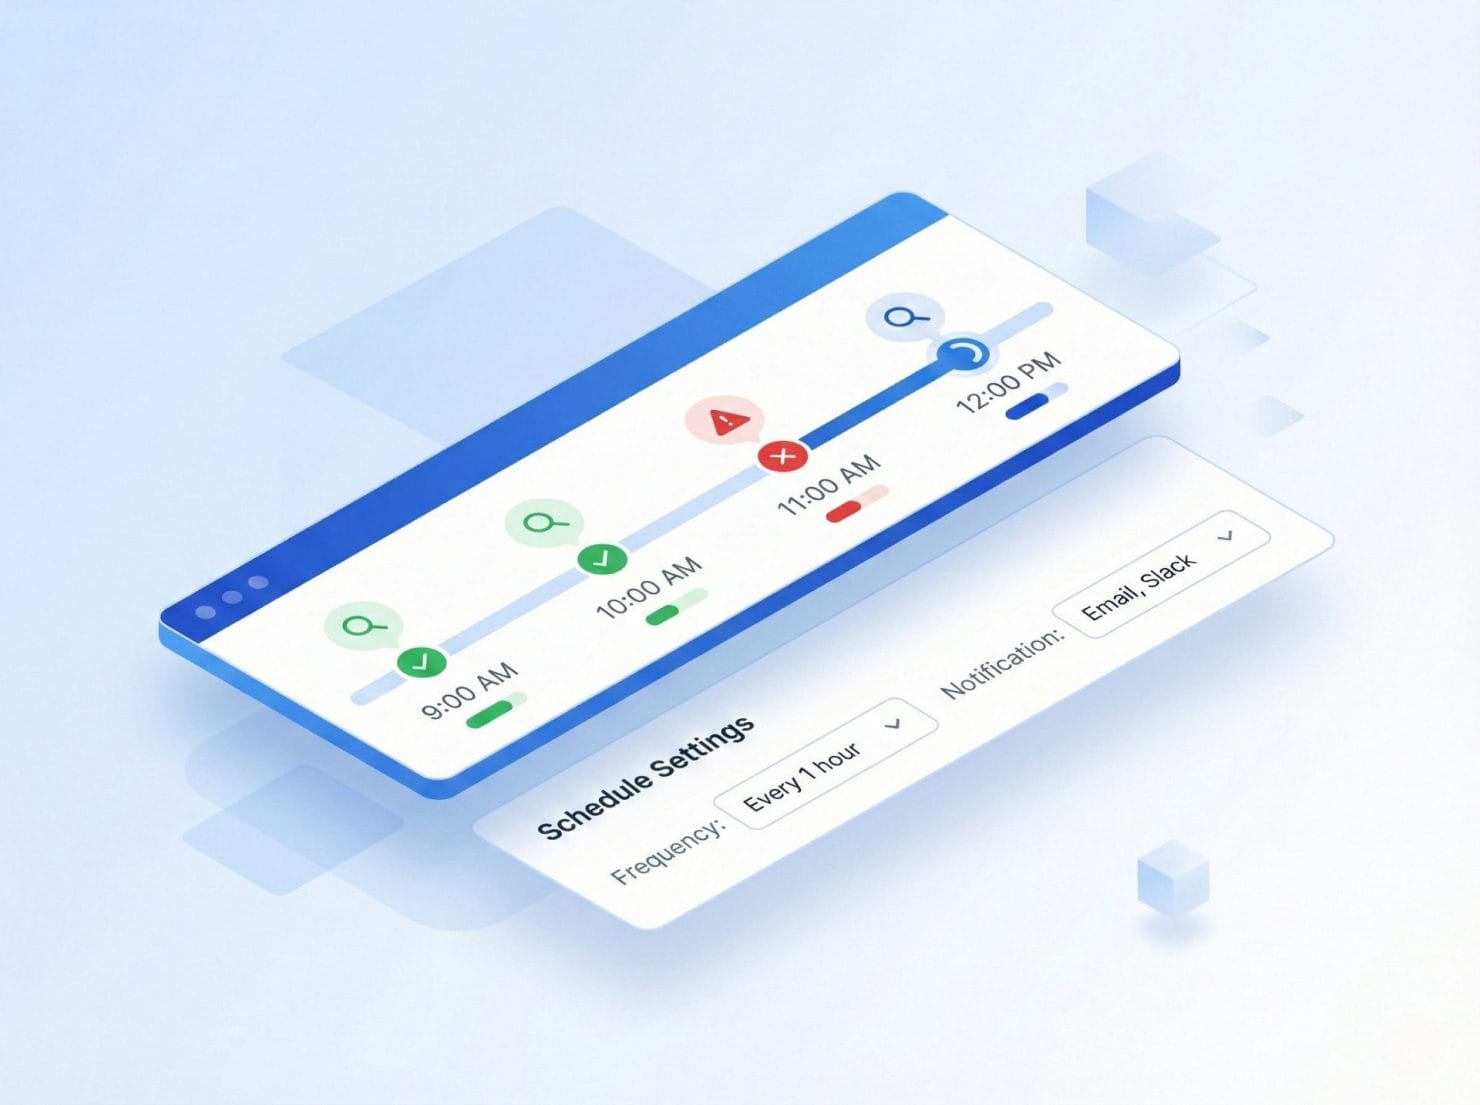
Scheduled Monitoring

Takes screenshots at regular intervals—every 15 minutes, hourly, daily, or anywhere in between. Catches hacks, expired SSL, CDN issues, and more.

Manual Checks

On-demand screenshots with a structured before/after workflow. Perfect for QA before deploying changes or verifying fixes in staging.

Alert Configuration

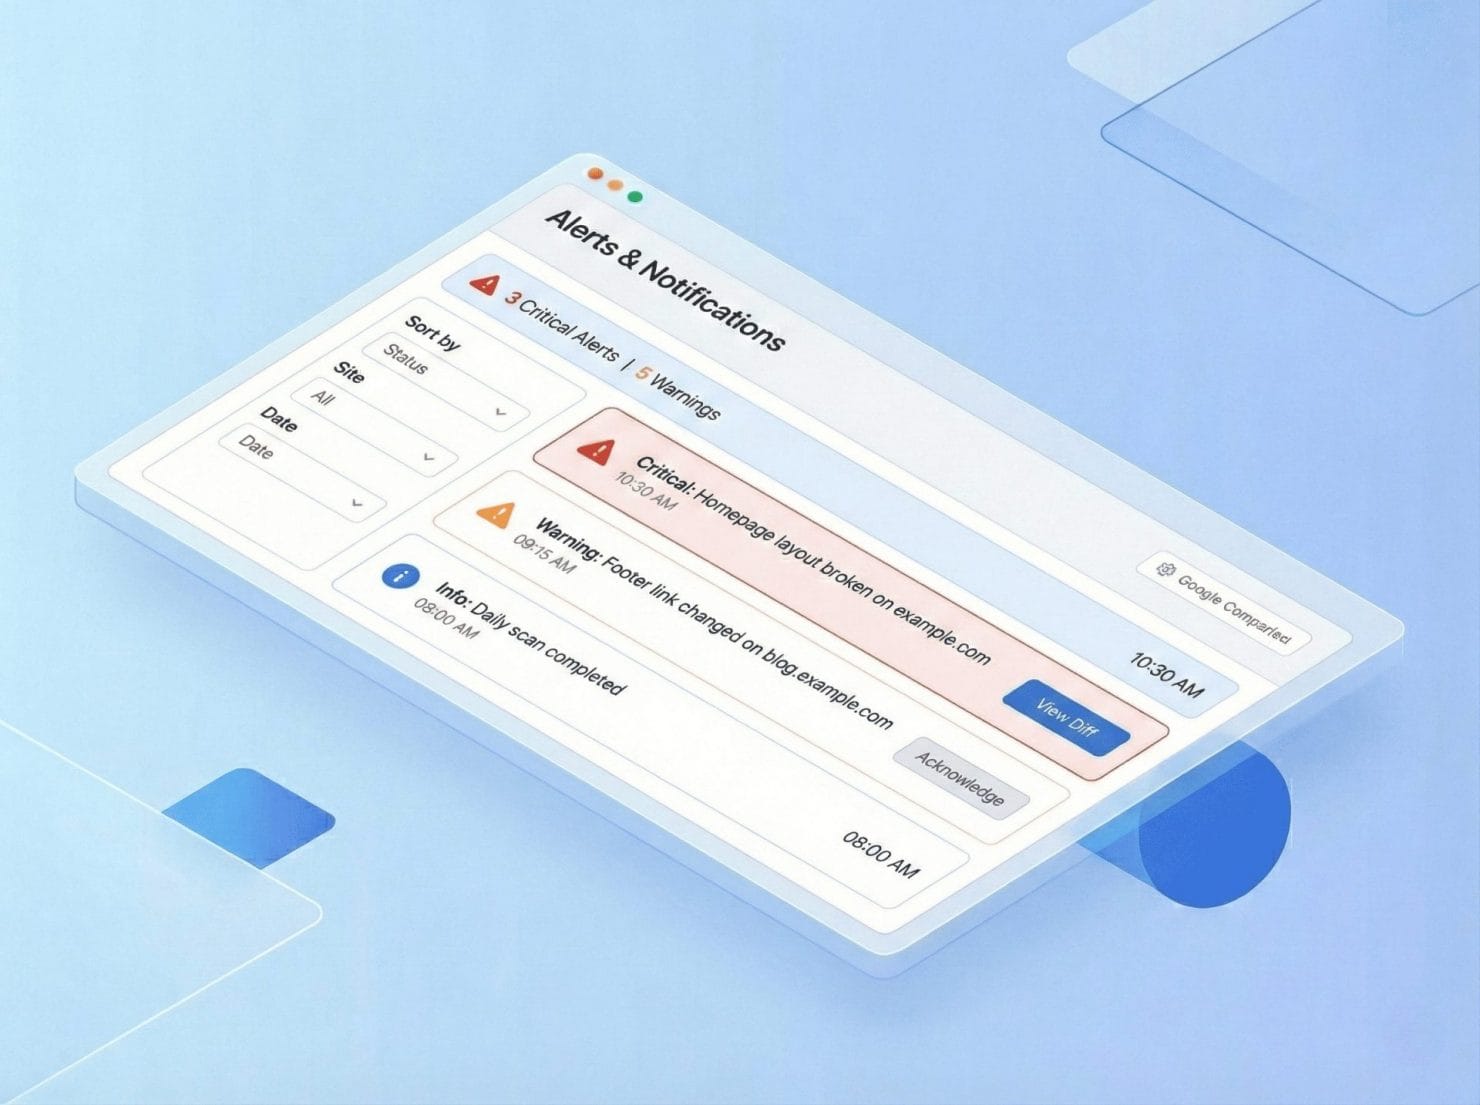
When changes exceed your threshold: instant email alert, visual preview of what changed, direct link to full comparison, and one-click status update.

Multiple Recipients: Different alerts for different people—QA team, account managers, or yourself

Threshold-Based Triggering: Choose 1%, 5%, 10%, or custom thresholds to control alert frequency

Smart Filtering: Changes below threshold are logged but don’t hit your inbox
Status Management

When changes are detected, mark them with one of four statuses to keep your change history organized. Know at a glance what’s been reviewed and what hasn’t.

“New”: Just detected, needs review and shows in ‘needs attention’ list

“OK”: Reviewed, change is fine—clears from alerts and updates baseline

“To Fix”: Real issue, stays flagged until resolved

“False Positive”: Not a real change, helps train your intuition
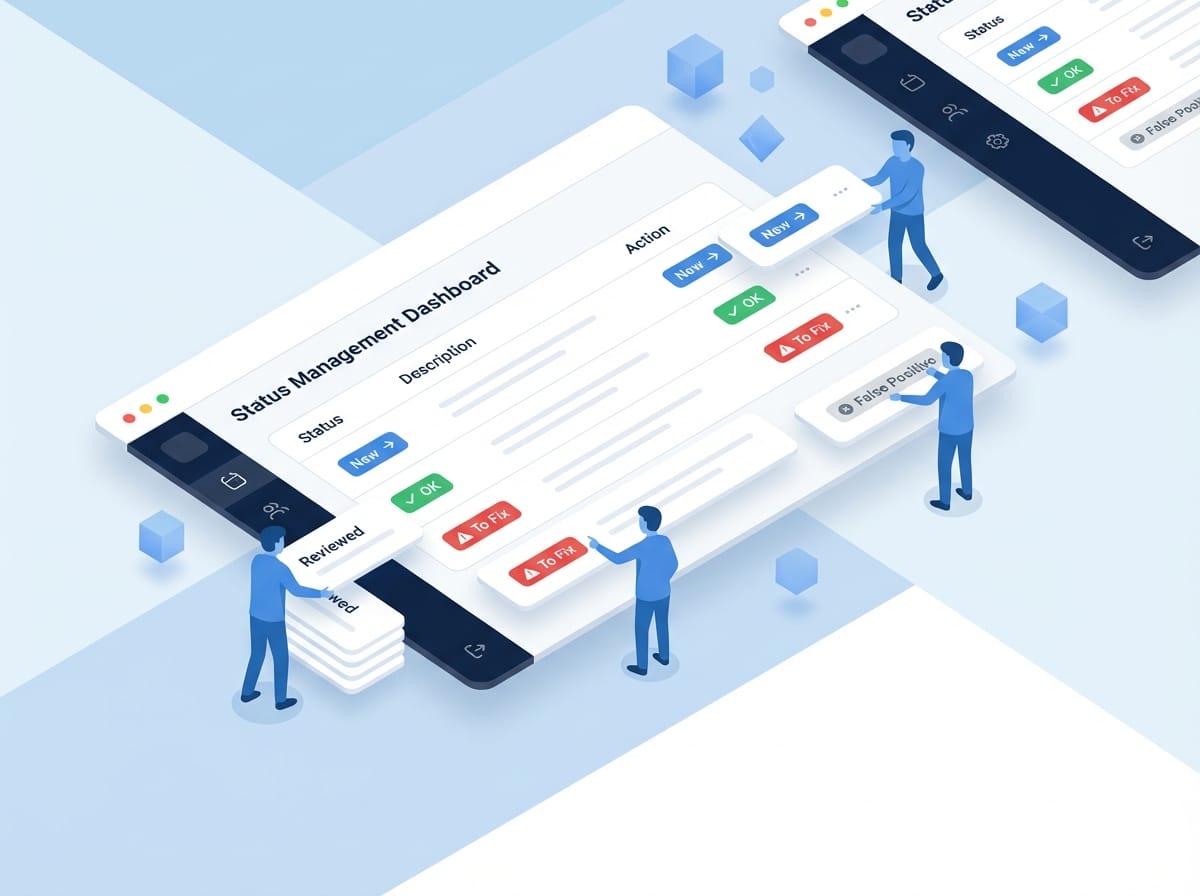
Isometric 3D illustration showing faceless blue figures managing website change statuses with UI cards displaying review workflow options

Update-Related Issues

Broken layouts from plugin conflicts, missing styles after theme updates, JavaScript errors breaking functionality, responsive issues introduced by updates

Unexpected Changes

Defaced pages from hacks, broken images from deleted media, missing content from database issues

Third-Party Failures

CDN outages showing broken images, external widget failures, payment gateway errors

Slow-Burn Problems

Gradual layout drift, accumulating console errors, content unexpectedly disappearing

JavaScript Errors

Browser console tracking for errors, failed network requests, deprecation notices

Console Log Monitoring

Every screenshot captures browser console output including JavaScript errors, failed network requests, warning messages, and deprecation notices. Get alerted not just when pages look broken, but when they are broken—even if it’s not visible yet.

JavaScript Errors: Catch runtime errors before they impact users

Network Failures: Detect failed API calls, broken CDN links, and missing resources

Deprecation Warnings: Identify outdated code patterns before they break
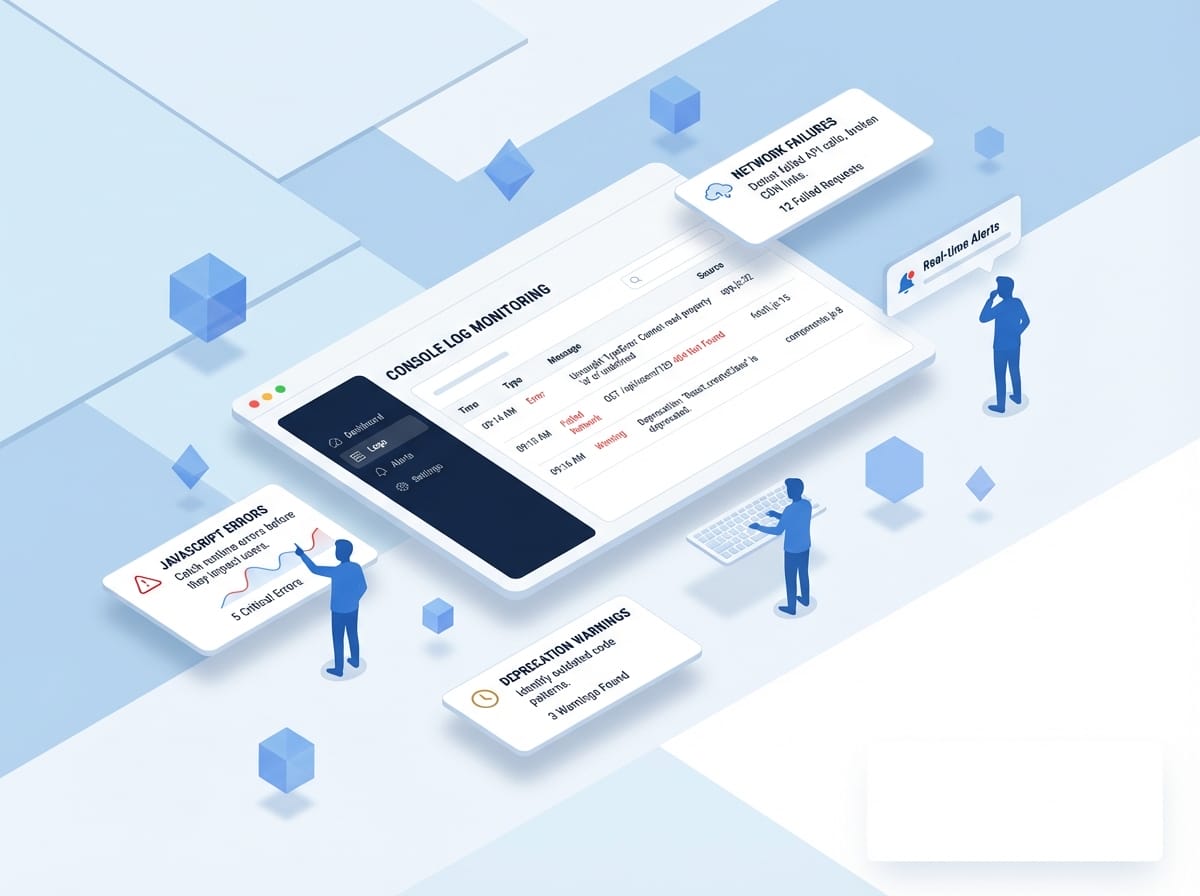
Isometric 3D illustration showing faceless blue figures analyzing browser console logs with error alerts and network monitoring UI cards

Set Up Monitoring in 5 Minutes

Connect your first site, choose your settings, and let us watch. Your future self (the one who catches bugs before clients do) will thank you.

Frequently Asked Questions

How many sites can I monitor?

Unlimited. Your plan’s check limit is the only constraint, and checks are shared across all sites.

What counts as a “check”?

One check on two devices. A full page on desktop + mobile = 1 checks. A 10-page site on both devices = 10 checks per monitoring cycle.

Can I pause monitoring temporarily?

Yes, per site or per group. Useful during planned maintenance.

Do you store all historical screenshots?

Yes, for your plan’s retention period. Review past comparisons anytime.