WebChange Detector takes scheduled screenshots of your pages and compares each one to the previous version, pixel by pixel. When something changes, you get an alert. When nothing changes, you hear nothing. When the change is just a rotating banner or a cookie popup, AI verification filters it out so it does not spam your inbox.
This guide covers every monitoring option in WebChange Detector: what each setting does, when to use it, and how to configure it. By the end, you will have a complete picture of how to set up monitoring that catches real problems without generating noise.
How Monitoring Works: The Technical Overview
Before configuring anything, it helps to understand what actually happens under the hood.
Schedule triggers
      ↓
WCD takes screenshot of your page
      ↓
Comparison to previous screenshot
      ↓
Difference % calculated
      ↓
Is difference % above threshold?
      ├─ No  → Mark as OK. No alert sent.
      └─ Yes → AI verification runs
                    ↓
                    ├─ All good (dynamic element: slider, ad, banner) → No alert
                    ├─ Not sure → Alert sent
                    └─ Alert (real change: text, layout, navigation) → Alert sent
A few key concepts to understand before diving into settings:
Monitoring Groups: All monitoring is organized into groups. A group is a container that holds a list of URLs plus all the settings that apply to those URLs: how often to check, what threshold to use, which emails to notify, and so on. One group can monitor dozens of pages under the same settings.
Difference Percent: When WCD compares two screenshots, it calculates what percentage of pixels changed. A value of 0.5% means roughly 1 in 200 pixels is different. This number drives the threshold system.
Threshold: The minimum difference percent that triggers an alert. At 0.0% (the default), any pixel-level change triggers the alert pipeline. At 0.5%, only changes that affect at least half a percent of pixels get flagged. Use this setting with care, as even 0.1% difference can be a significant breaking change.
AI Verification: WCD uses AI to look at each region of a comparison and classify it: is this a real content change, or a dynamic element like a rotating ad? This dramatically reduces false positives on busy, dynamic pages.
Result Statuses: After processing, each comparison gets a status: New (change detected), OK (no change or below threshold), To Fix (reviewed, needs action), or False Positive (confirmed not a problem).
Part 1: Setting Up a Monitoring Group
What is a Monitoring Group?
A monitoring group defines what to monitor and how. Every URL you monitor belongs to one group. The group holds all the scheduling, alerting, and screenshot settings that apply to those URLs.
WCD has two group types:
- Monitoring Groups (automatic): WCD takes screenshots on a schedule and compares them automatically. This is what this guide covers.
- On-Demand Check Groups: You trigger screenshot comparisons manually, typically before and after deployments or updates. Or via the WP auto-updates.
Creating Your First Monitoring Group
- Log in to your WebChange Detector dashboard
- Navigate to Monitoring in the sidebar
- Click Add New Group
- Name the group (e.g., “Client A – Key Pages” or “Homepage + Sales Pages”)
- Set the group type to Monitoring
- Configure your schedule (covered in detail in Part 2)
- Add URLs to the group
- Save

Adding Websites and URLs
You add websites to monitor from the Monitoring or On-Demand Checks tab. There are three ways to add websites:
Option 1: Paste URLs Manually
Add any publicly accessible URL by pasting it directly. This works for any website, not just WordPress.
- Open the group and click Add URLs
- Paste your URLs, one per line
- For each URL, choose whether to capture Desktop, Mobile, or both
Option 2: Connect a WordPress Site via REST API
For WordPress websites, connect them directly through the REST API. This syncs all pages and posts automatically, so you can select which ones to monitor from the full page list.
- Go to the WordPress Websites section
- Enter the site URL and authenticate via REST API
- WebChange Detector syncs all pages and posts from the site
- Select the pages you want to monitor and add them to your group
Option 3: Install the WebChange Detector WordPress Plugin
The fastest option for WordPress sites. Install the WebChange Detector plugin on the WordPress site, and it handles the connection and page syncing automatically.
- Install and activate the WebChange Detector plugin on the WordPress site
- Connect it to your WebChange Detector account
- The plugin syncs all WordPress pages and posts automatically
- Select pages to monitor from within the plugin or from the webapp

Group-Level vs. URL-Level Settings
Most settings apply at the group level and affect all URLs in that group. However, a few settings can be added per URL:
| Setting | Group Level | Per-URL Override |
|---|---|---|
| Schedule (interval, days, hours) | Yes | No |
| Threshold | Yes (default for all) | Yes |
| Desktop / Mobile | No | Yes |
| CSS Injection | Yes (applies to all) | Yes (adds to group) |
| JS Injection | Yes (applies to all) | Yes (adds group) |
Part 2: Schedule Options
The schedule controls when WCD takes screenshots. There are three schedule types, each suited to different monitoring needs.
Interval Schedule (Default)
The most common schedule: WCD runs at a fixed interval, repeating continuously.
Available intervals:
- Every 15 minutes
- Every 30 minutes
- Every 1 hour
- Every 3 hours
- Every 6 hours
- Every 12 hours
- Every 24 hours (daily, the default)
Starting hour: Sets the hour of day (0–23, in UTC) from which the interval counts. With a 6-hour interval and a starting hour of 8, monitoring runs at 08:00, 14:00, 20:00, and 02:00.
When to use interval scheduling: Ongoing monitoring of production pages, high-value pages that need frequent checks (homepage, checkout, pricing), or pages that update frequently (news, product listings).
Weekly Schedule
Run monitoring on specific days of the week, at a configured time.
Day selection: Monday through Sunday, any combination. Example configurations: Weekdays only (Mon–Fri), after weekend deployments (Monday only), or before releases (Tue, Wed, Thu).
When to use weekly scheduling: Pages that only need checks on business days, post-update verification on a predictable day, or lower-priority pages that do not require daily monitoring.
Monthly Schedule
Run monitoring on specific dates within the month.
Date selection: Any combination of dates 1 through 30, plus a “Last day of month” option that adapts to month length (28, 29, 30, or 31 days).
When to use monthly scheduling: Compliance checks that only need monthly snapshots, end-of-month reporting baselines, or low-change pages like legal, privacy policy, or about pages.
Part 3: Quiet Hours
Quiet hours define a time window during which monitoring is paused. No screenshots are taken during this window, regardless of what the schedule says.
When Quiet Hours Are Useful
Planned deployments: If you push updates every Tuesday night between 22:00 and 02:00, set quiet hours for that window. Monitoring resumes after the deployment window, and the next comparison reflects the updated site rather than mid-deployment states.
Scheduled maintenance: If a client runs automated backups or maintenance scripts that temporarily alter page content, quiet hours prevent false alerts during that window.
Staging environments: Some staging sites show maintenance banners during off-hours. Quiet hours prevent those banners from generating alerts.
Save monitoring checks: Skip checks during the night or low traffic hours to save checks to use them during the day.
How to Configure Quiet Hours
- Open your monitoring group settings
- Scroll to the Quiet Hours section
- Set the Start Hour (0–23, the hour when monitoring pauses)
- Set the End Hour (0–23, the hour when monitoring resumes)
- Save
Midnight-spanning windows work correctly. If you set start to 22 and end to 06, WCD correctly pauses from 22:00 through 05:59 and resumes at 06:00. You do not need to split this into two separate configurations.
Part 4: Sensitivity (Threshold)
The threshold controls how large a visual change must be before WCD considers it worth alerting.
What Threshold Means
Threshold is expressed as a percentage of pixels. A threshold of 0.5 means: only flag this comparison if more than 0.5% of all pixels changed between the two screenshots.
Default: 0.0% — any pixel-level change triggers the alert pipeline.
We recommend leaving the threshold at 0% for all trial and paid plans. Even a 0.1% change can mean a breaking change on a website. AI analysis will filter noise more efficient.
Part 5: Alert Configuration
Email Alerts
WCD sends email alerts when monitoring detects a change that passes the threshold and AI verification.
Multiple recipients: Each monitoring group has its own list of alert email addresses. You can add as many recipients as needed, separated by commas. This is useful for agency setups where both you and the client want to be notified.
What the alert email contains:
- Summary of which pages changed
- AI-generated summary of what changed (2–3 sentences)
- Direct links to view each comparison in the dashboard
- Thumbnail previews of the before/after screenshots
When alerts are triggered:
- For plans with AI verification: when the AI classifies a region as Alert or Not Sure
- For plans without AI verification: when difference_percent exceeds the threshold
- Additionally: when new browser console errors appear (critical or warning severity)
To configure alert emails, open your monitoring group settings and find the Alert Emails field. Enter one or more email addresses, separated by commas, and save.
Webhook Alerts
For teams that have their own alerting pipelines, WCD supports webhooks. Instead of sending an email, WCD sends a POST request to your URL whenever a monitored event occurs.
Available webhook events:
| Event | When It Fires |
|---|---|
batch_finished | A complete monitoring run has finished processing |
comparison_status_new | A single comparison was flagged as a change |
comparison_status_new_collection | Multiple comparisons from the same batch were flagged |
comparison_summary | Summary payload for a completed batch |
queue_status_done | A screenshot job completed successfully |
queue_status_failed | A screenshot job failed |
Common integrations: Slack (via incoming webhook URL to route WCD alerts directly into a channel), Zapier (native integration connecting to 5,000+ apps, create Jira tickets, send SMS, update spreadsheets), or custom pipelines where you process the webhook payload in your own system.
To configure webhooks, navigate to Settings > Webhooks in your WCD dashboard.
Part 6: Device Options
For each URL in a monitoring group, you can independently enable desktop and mobile screenshot capture:
- Desktop only: Full-width browser screenshot. Best for sites with no mobile-specific layout differences.
- Mobile only: Narrow viewport screenshot simulating a mobile device. Best for mobile-first sites.
- Both: WCD takes two independent screenshots and runs two separate comparisons. Layout regressions on mobile are detected independently from desktop issues.
Why monitoring both matters: Responsive CSS and media queries mean the desktop and mobile views can break independently. A change to a flexbox layout might only affect mobile, while a navigation dropdown issue might only appear on desktop.
Part 7: Advanced Screenshot Settings
Screenshot Delay
After a page finishes loading, WCD waits before taking the screenshot. This delay gives the page time to fully render: animations to settle, lazy-loaded images to appear, AJAX-loaded content to populate.
Default delay: 7 seconds. Range: 7 to 60 seconds.
When to increase the delay: Pages with heavy JavaScript that loads content after the initial render, pages with entrance animations, sites using skeleton loaders or lazy-loading, or chat widgets and notification bars that load asynchronously.
When to keep the default: Static pages or pages with minimal JavaScript where you do not need to wait for below-the-fold lazy-loaded content.
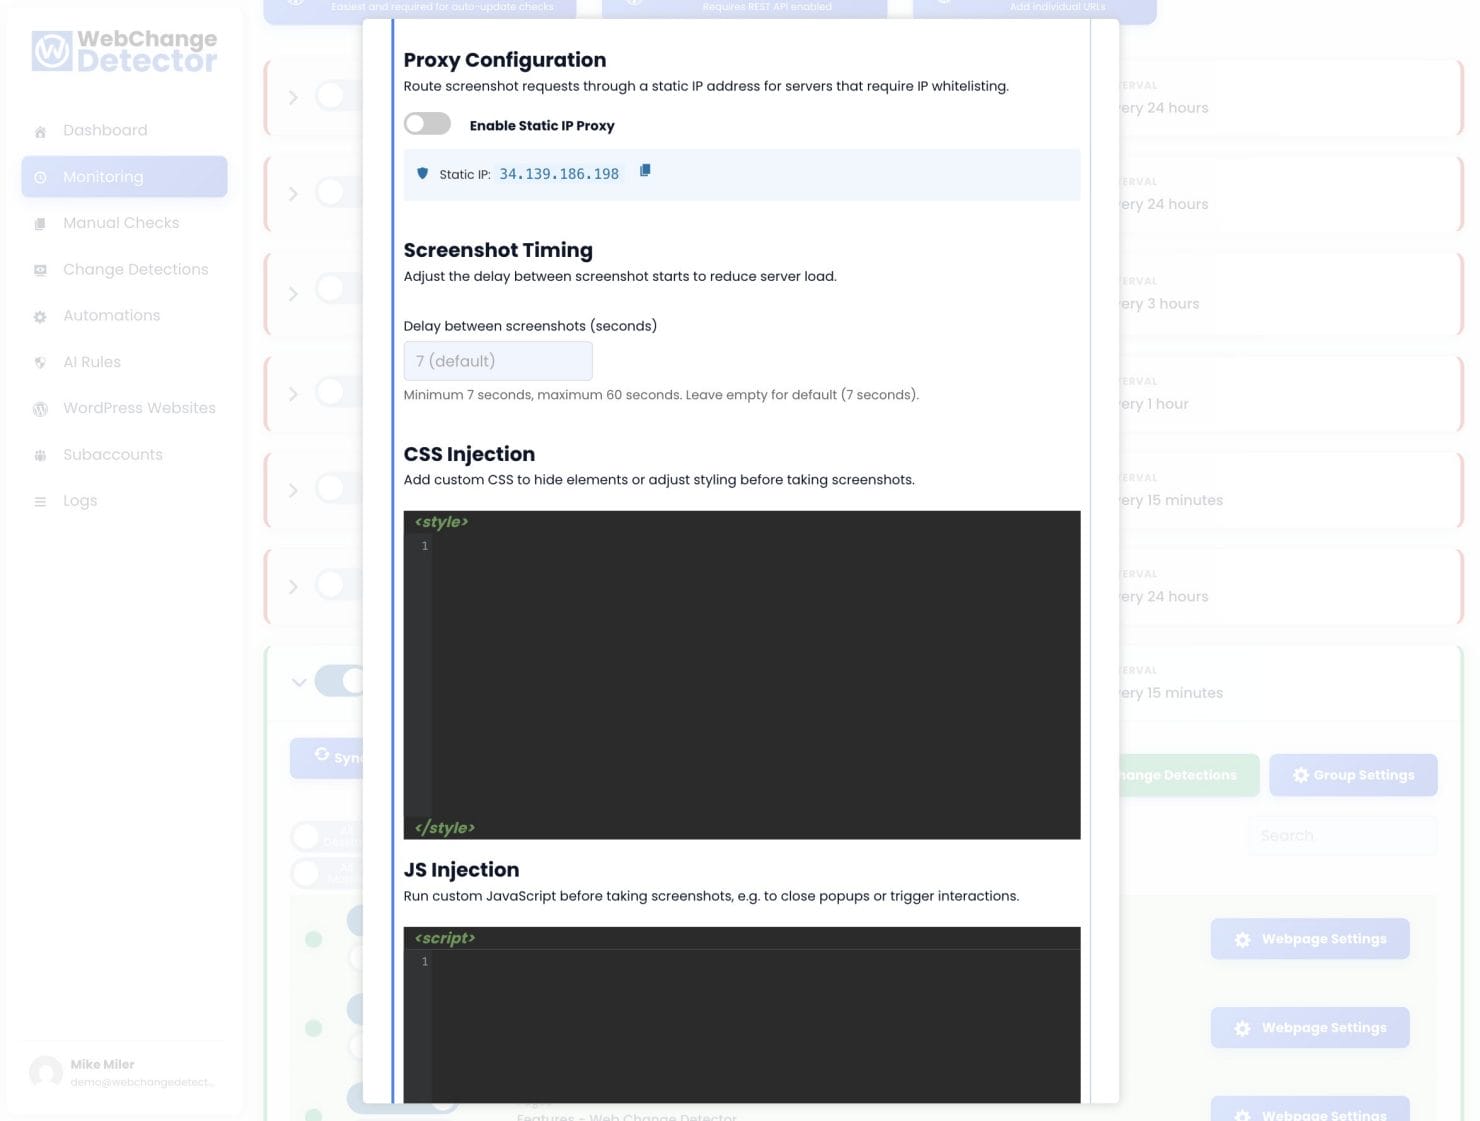
CSS Injection
CSS injection lets you inject custom CSS into the page before the screenshot is taken. The CSS is applied and rendered, then the screenshot is captured. It does not affect the live site in any way.
Primary use case: hiding dynamic elements. Dynamic elements that change every page load (rotating ads, live chat widgets, countdown timers) will trigger alerts on every single monitoring run. Instead of setting a high threshold to mask these changes, use CSS to hide the offending elements before the screenshot.
Examples:
/* Hide a live chat widget */
.intercom-lightweight-app { display: none !important; }

/* Hide a countdown timer */
.countdown-timer { display: none !important; }
Group-level CSS applies to all URLs in the group — the right choice when the same element appears on every page (e.g., a sitewide chat widget). Per-URL CSS applies only to a specific URL and overrides the group setting. Use this for a page that has a unique dynamic element not present elsewhere.
JavaScript Injection
JS injection executes custom JavaScript on the page before the screenshot is taken. This is more powerful than CSS injection and enables interactions that CSS alone cannot handle.
Common use cases: Accepting a cookie consent programmatically, closing a modal that opens on page load, scrolling to a specific section before the screenshot, setting a localStorage value that affects page behavior, or dismissing a notification banner.
// Close a welcome modal by removing it from the DOM
const modal = document.querySelector('.welcome-modal');
if (modal) modal.remove();
Like CSS injection, JS can be set at the group level (runs on all URLs) or per-URL (overrides the group setting for that specific page).
Basic Authentication
If a page is behind HTTP basic authentication (username and password required at the server level, typically used for staging environments), WCD needs the credentials to access it.
To configure: open your monitoring group settings, find the Basic Authentication section under Advanced Settings, enter the username and password, and save. The credentials are stored encrypted and apply to all URLs in the group.
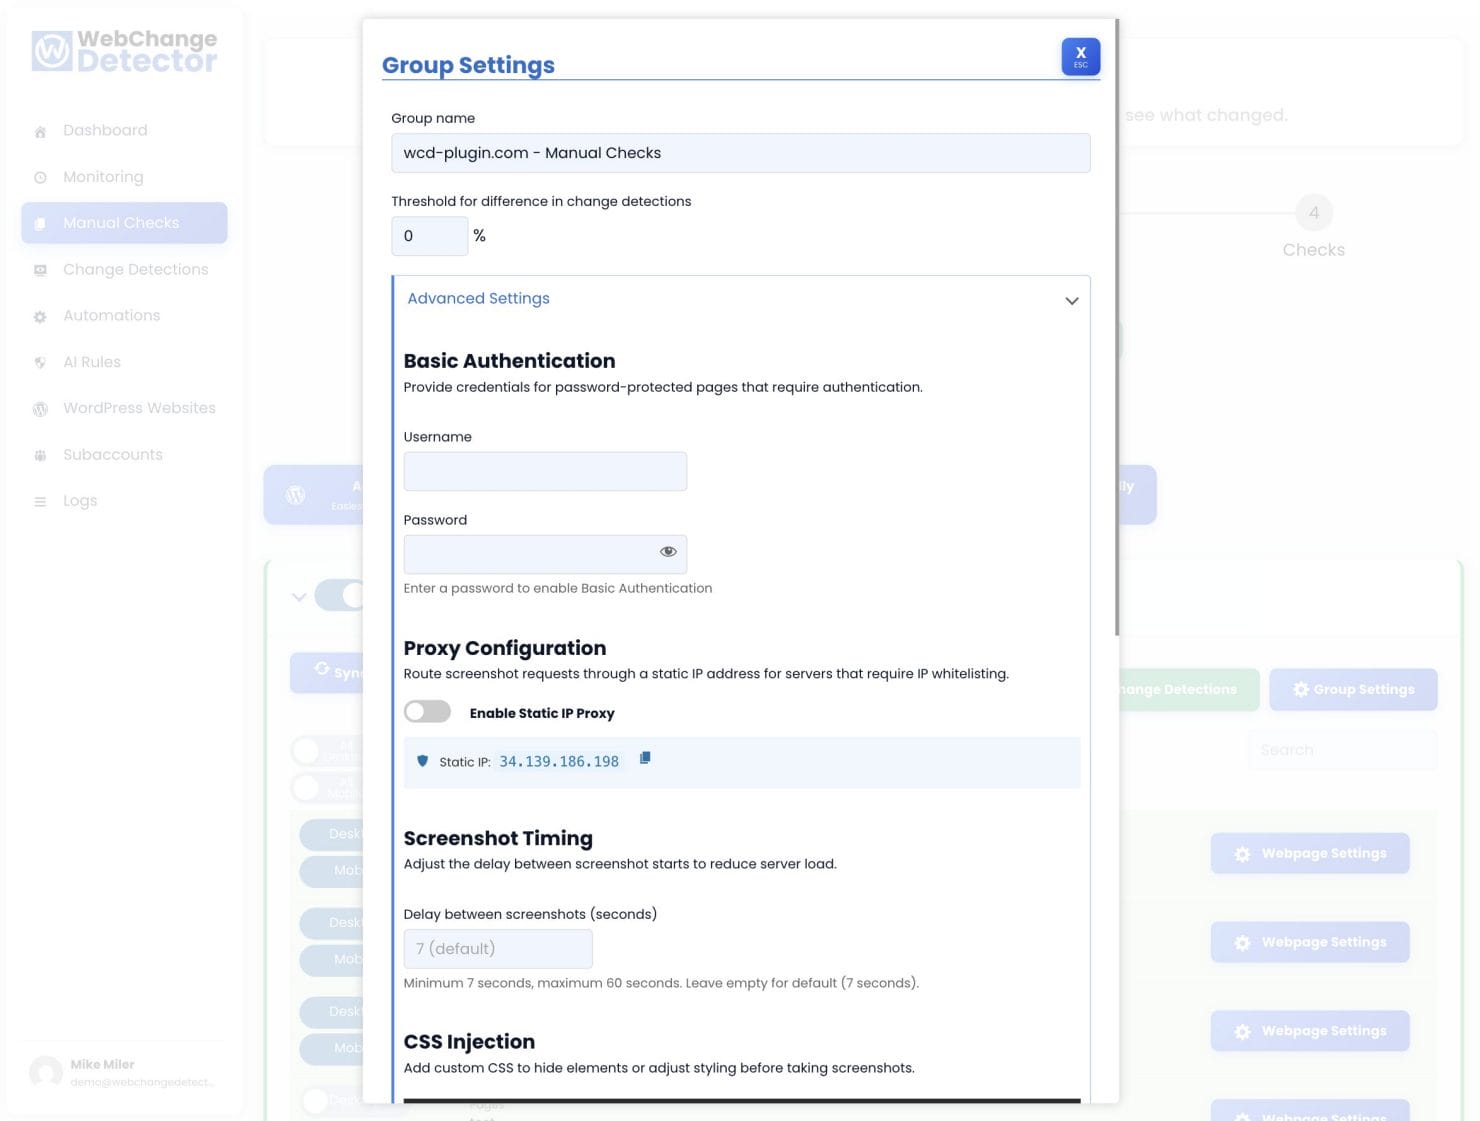
Proxy Settings
By default, WCD screenshots are taken from randomly changing IP addresses in our cloud infrastructure. For sites with strict security rules that block cloud provider IPs, WCD offer the static proxy option.
This routes all screenshots through a single, fixed IP address (34.139.186.198). Whitelist this IP in your firewall and all WCD traffic will always come from that address. Best for sites behind WAFs like Cloudflare, Sucuri, Wordfence, or managed hosting firewalls.
For a full guide on resolving firewall blocking issues, see our post: How to Stop Firewalls From Blocking Your Screenshots.
Part 8: AI Verification
Visual pixel comparison detects that something changed. AI verification adds an intelligence layer that classifies whether the change matters. After a change is detected, the AI analyzes each changed region and categorizes it as All Good (dynamic content like rotating banners), Alert (real content change), or Not Sure (needs your review). Only changes classified as Alert or Not Sure trigger email notifications.
The AI also analyzes browser console output for new JavaScript errors and generates batch summaries for quick triage. You can create feedback rules to teach the system about expected changes on your specific sites.
For the full details on AI categories, feedback rules, and the review workflow, see: How to Review Change Detections.
Reading Monitoring Results
Monitoring results appear in the Change Detections tab. Each monitoring run creates a batch containing all comparisons for that cycle. Click any comparison to open the full popup with before/after slider, diff overlay, and AI analysis sidebar. Each comparison also has an encrypted share link you can send to clients without requiring them to log in.
For a complete walkthrough of the comparison popup and review workflow, see: How to Review Change Detections.
Best Practices
Start conservative, tune down. Begin with a 24-hour interval. Once you understand which pages change frequently, increase the frequency on high-value pages and leave lower-traffic pages on daily checks.
Use CSS injection for sitewide dynamic elements. If a site has a weeday specific design, or personalized greeting that appears on every page, add CSS to hide it at the group level before your first monitoring run. This prevents false alerts from day one.
Add quiet hours around deployments. If there is a predictable deployment window, configure quiet hours so WCD does not flag mid-deployment states.
Monitor both desktop and mobile for key pages. For your most important pages (homepage, pricing, checkout), enable both. Responsive regressions often only appear on one viewport size.
Create separate groups for different monitoring frequencies. Put critical pages (homepage, checkout, pricing) in a group with a 1–6h interval. Put standard pages in a 24h group. Put low-change pages (legal, FAQ) on a weekly schedule. This gives high-priority pages the attention they need without consuming excessive credits on low-change content.
Use webhooks to integrate with your workflow. If your team uses Slack, configure a webhook to post WCD alerts directly into a dedicated channel. The right person sees the alert immediately instead of it sitting unread in an inbox.
Review and mark false positives. When you see an alert for a dynamic element WCD should have ignored, mark it as a false positive. If the same element keeps generating false alerts, add a CSS rule to hide it.
Configuration Quick Reference
| Setting | Where to Configure | Notes |
|---|---|---|
| Schedule type (interval / weekly / monthly) | Group Settings > Schedule | Applies to all URLs in group |
| Monitoring interval | Group Settings > Schedule | 15 min to 24 h |
| Starting hour | Group Settings > Schedule | UTC hour, 0–23 |
| Quiet hours | Group Settings > Quiet Hours | Supports midnight-spanning windows |
| Threshold (sensitivity) | Group Settings > Threshold | 0.0% = maximum sensitivity |
| Per-URL threshold | URL Settings (click URL row) | Overrides group threshold |
| Alert emails | Group Settings > Alert Emails | Comma-separated list |
| Webhooks | Settings > Webhooks | Event-based, global setting |
| Desktop monitoring | URL Settings | Per-URL toggle |
| Mobile monitoring | URL Settings | Per-URL toggle |
| Screenshot delay | Group Settings > Advanced | 7–60 seconds, default 7 |
| CSS injection (group) | Group Settings > Advanced | Applies to all URLs |
| CSS injection (URL) | URL Settings | Overrides group CSS |
| JS injection (group) | Group Settings > Advanced | Applies to all URLs |
| JS injection (URL) | URL Settings | Overrides group JS |
| Basic authentication | Group Settings > Advanced | Encrypted, applies to all URLs in group |
| Proxy type | Group Settings > Advanced | None / Static IP / Residential |
| Proxy country | Group Settings > Advanced | Two-letter ISO code (residential only) |